Projects and Products
A selection of my recent GIS and Remote sensing projects, and an overview of a few or the products I have delivered at Slingshot Aerospace and BlackSky

BlackSky's Marketplace Listing

Me, giving a demo theater presentation at the 2022 Esri User Conference

BlackSky Tasking for ArcGIS Featured at the Esri Partner Conference
BlackSky's Marketplace Listing
Marketplace Listing: https://www.esri.com/en-us/arcgis-marketplace/listing/products/1f5319dc84ab4f3394ec7c7208a99c7e
For More Information: https://www.blacksky.com/esri/
Project |01
BlackSky Tasking for ArcGIS Online
I was the lead product manager from ideation to launch of the BlackSky Tasking for ArcGIS Online App, a first of its kind application allowing users to task a satellite from within an Esri environment and transfer the imagery to ArcGIS Online. This app is regarded by the Esri Imagery team to be the most heavily integrated partner app. I managed four different engineering teams from three companies to produce and launch this app. We launched the app at the Esri User Conference in 2022. This app marked BlackSky's first step towards reaching smaller commercial customers.
Project | 02
Strategies for Reducing the Complexity of Human-in-the-Loop Labeling Tasks
I teamed up with a coworker to present a virtual lightning talk at the 2020 GEOINT Symposium. We discuss the challenges of collecting image based training data via human-in-the-loop labeling methods and present a novel solution for simplifying complex data labeling tasks.
Project | 03
211LA FoodFinder
https://foodfinder.211la.org/
I led a team of developers and data scientists to build 211LA's FoodFinder app. This app provides a simple way for users to identify food resources in their neighborhood and provides contact and service information about those resources. This app helped reduce call volume to 211LA to a manageable level during the increased demand seen in the COVID-19 pandemic.
Project | 04
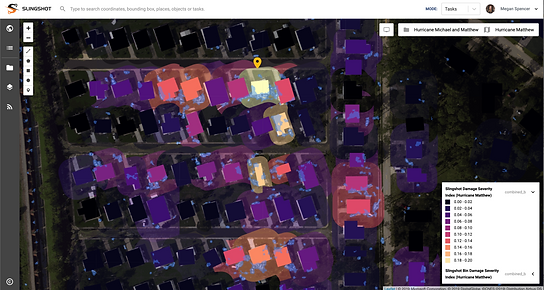
Earth Portal Debris Detection and Damage Assessment
I helped develop imagery analysis techniques to use machine learning damage detection inferences and other data sources to create an estimate of how severely a storm damaged a building. I assisted in turning this analysis into a pipeline and later was the product manager of Earth Portal, a platform built to disseminate this information to insurance companies and other stakeholders.
Project | 05
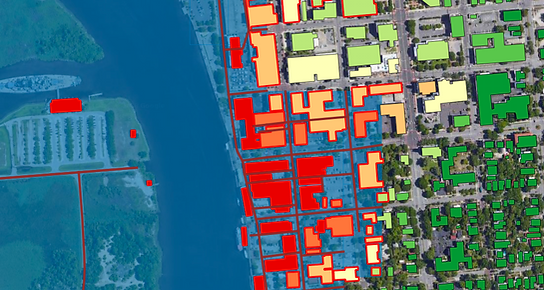
Earth Portal Flood Detection and Flood Depth Estimation
I developed flood detection techniques using SAR and hyperspectral satellite imagery. I used other data sources, such as soil models, high resolution elevation models, and flood plain data to detect flooding and estimate flood depth after a major flooding event. The data was displayed in an interactive web map called Earth Portal for first responders and insurance companies.
For more information: https://www.planet.com/pulse/slingshot-aerospace-maps-flooded-areas-following-hurricane-harvey/
Project | 06
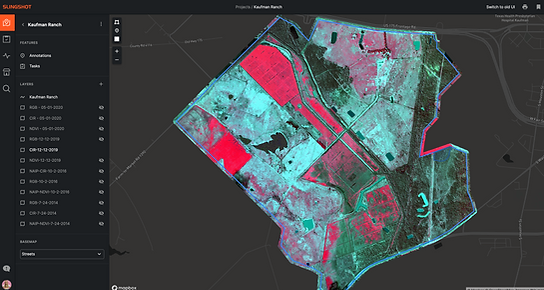
Slingshot Earth Agriculture Applications
I used multispectral data to estimate plant health on a rural ranch in west Texas, saving the rancher trips to the ranch. I also used elevation and soil information to identify areas of poor drainage and potential flood zones. The information was distributed with Slingshot Earth, a redesigned version of Earth Portal. I oversaw the redesign effort as the product manager, gathering feedback from users to guide the redesign.


Project Website:
http://laketahoesnowpackflooding.weebly.com
Project | 07
Using Remote Sensing to Estimate Flooding Risk Associated with Rain-on-Snow Events in the Lake Tahoe Basin
We used remote sensing to quantify the extent and depth of the snowpack, and looked at the temperature of the surrounding areas in nearby mountains of Lake Tahoe to analyze the speed of snowpack melting and give an estimate regarding potential flooding risks for the Lake Tahoe Basin. We did this by looking at snowpack conditions before and after rain-on-snow events, and identified a pattern to help us predict when such flooding could happen again, and to what extent the Lake Tahoe Basin would be flooded.


Project | 08
Mapping Wildfires in Apple Valley, CA and Identifying Under protected Areas of the City
In this cartography focused project I mapped important community buildings and fire stations in the town of Apply Valley, CA with the locations of previous wildfires to find under protected regions of the city. I recommended a site for a new fire station to better protect the community.
Project | 09
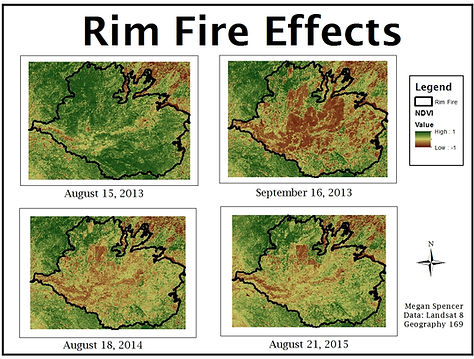
Measuring Vegetation Health Before and After a Wildfire using Normalized Differential Vegetation Index (NDVI)
This project used Landsat Data from before and after the 2014 Sierra Nevada Rim fire to monitor change in vegetation health from before and after the fire. The NDVI rasters were created in ENVI while the maps were created in ArcMap.
Project | 10
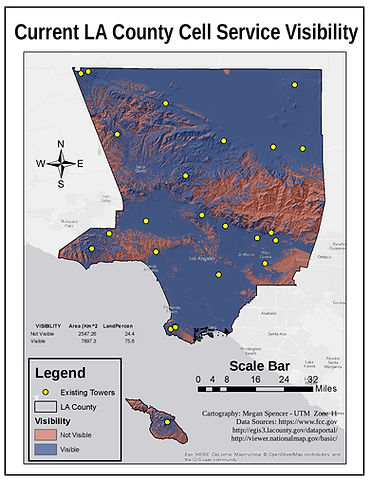
Using Visibility Mapping to Monitor LA County Cell Phone Service Coverage
This project used cell tower data containing the location, height, and range of each cell phone tower to determine how much of LA county had cell phone service. ArcMap's visibility feature was used, which factors a tower's range and height as well as the surrounding landscape's slope and aspect to determine which parts of LA county receive unobstructed cell phone signal.


Project | 11
Comparing ArcMap Watershed Analysis Algorithm to HydroSHED Watershed Data on the Tibetan Plateau
In this project I used a watershed analysis algorithm in ArcMap to derive drainage basins and stream order networks in the Tibetan Plateau. I compared the derived watersheds to HydroSHED data to assess the accuracy of the algorithm, and I built a watershed analysis model and tool to automate the process for future watershed analysis projects.


Project | 12
Using Spatial Analysis to Identify Populations Vulnerable to Lahar Flooding
In this project I used a watershed analysis algorithm in ArcMap on an SRTM image the Mt. St. Helens area to identify the areas downstream of Mt. St Helens that would be vulnerable to Lahar Flooding in the event of an eruption. I calculated slope to identify low-slope low-elevation areas and mapped Census population data to identify regions of high population density. I identified areas that fell within all of these conditions and labeled them as being highly vulnerable in the event of an eruption of Mt. St Helens.


Project | 13
Using Python to Create Tools to Asses the Needs of School Districts in LA County
In this project we used Python and the ArcPy module to create code to turn into tools that could produce information that would be pertinent to school districts, such as the number of libraries within a district and the socioeconomic makeup of the school district. I created a script to create a mapbook from the information obtained by the other scripts to create an easy-to-read visual summary of information about the 83 school districts in LA County. The mapbook cover shows all schools and school districts in LA county, and information calculated and stored in the attribute table by other tools is extracted and displayed in a table on each district's mapbook page. Because the mapbook creation process in automated, it can be easily repeated as data is updated over time.


Project | 14
Vegetation, Slope, Aspect, and Solar Regime Analysis of the Santa Monica Mountains
The purpose of this project was to gather information about the types of vegetation that grow in the Santa Monica Mountains and understand under what conditions each type thrives. In this project, I mapped the distribution of different vegetation types in the Santa Monica Mountains, the Slope and Aspect of the terrain, and the amount of incoming solar radiation for each of the four seasons. I used zonal statistics to summarize information into tables to find the typical slope, aspect, and solar regime for each type of vegetation.


Project | 15
Identifying Potential T-Mobile Expansion Zones in LA County Using QGIS
In this Project I used QGIS to identify areas outside of T-Mobile's current zone of coverage. I overlay Census Data to identify which of the areas outside the coverage zone contained the highest numbers of a younger population, and flagged these areas as the best opportunities for T-Mobile's cell coverage expansion.